Retention is a type of insight that shows you how many users return on subsequent days after first visiting your site or product.
Creating a retention insight
- Click 'Product Analytics' on the left sidebar
- Click the + New Insights tab
- Select the Retention tab
Understanding retention tables
The retention table is structured as follows:
Column 1: Cohort
The table starts from 11 days before the day you are viewing it, and each row is incremented by one day until "yesterday" (last row).
For Recurring Retention, the cohort is defined by the group of distinct users that performed the event on that time period.
For First Time Retention, the cohort is defined by the group of distinct users that performed the event for the first time on that time period.
Column 2: Users
The number of users included in the cohort i.e. how many users visited your page on that day.
Remaining columns (3+)
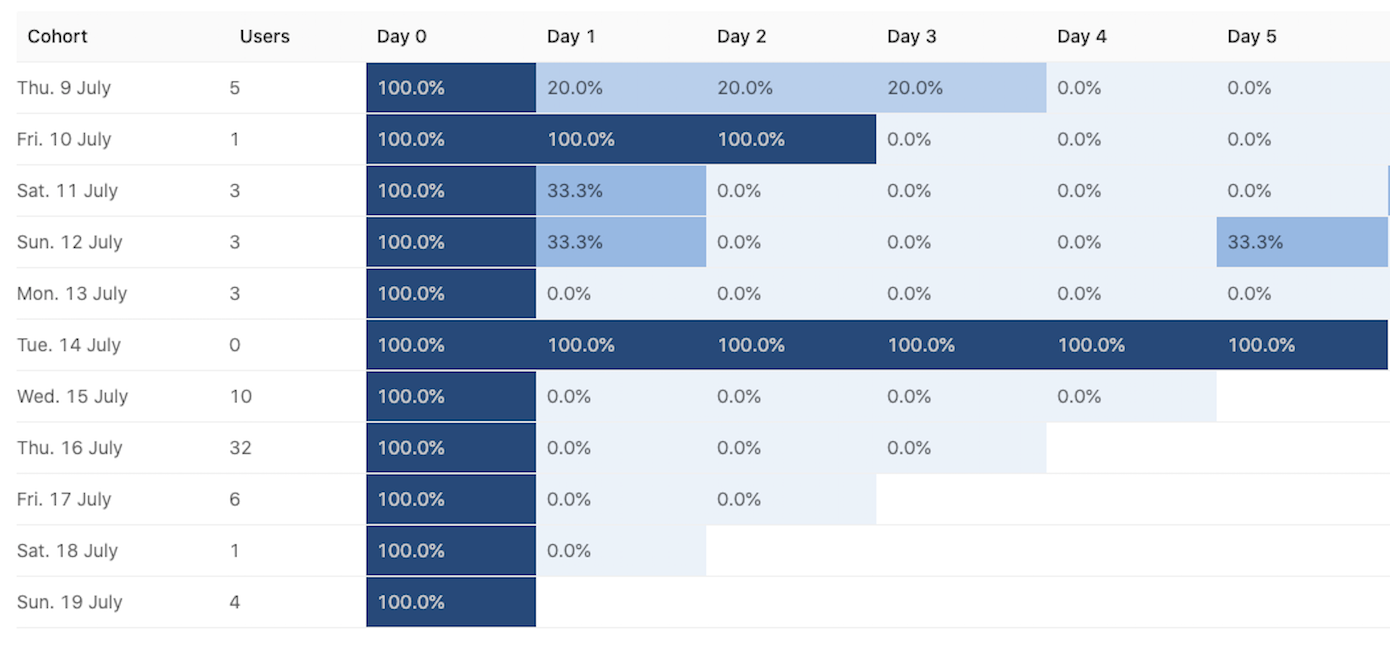
The remaining columns are the ones displaying retention. Day 0 is the day represented under the column 'Cohort', so it will always be 100%. The following columns will show you how many of the users who visited your webpage on the day marked under 'Cohort' came back and visited again on Day X.
It's easiest to explain retention using the following visual example:

- Looking at the row for "Sun. 12 July", 3 users visited the website on that day (Day 0).
- Then, the next day (Day 1), 33% of those users visited again. In other words, one of the distinct users who visited the website on the 12th also visited on the 13th. One of those users also visited once more on Day 5 (i.e. 5 days after the 12th -> 17th).
- Retention tracks distinct users and is a great way to see how well they are being retained. Do they come back often? Or do they just visit once? (More on this in the next section).
- Finally, note that the retention table is filled from the bottom up, in a queue-like manner. That means cohorts are added and removed on a First In First Out basis. They are added at the bottom of the table daily, and the first row (oldest) is removed from the top.
Users are distinct on each cohort, but not across cohorts. A user from the 12th who came back on the 15th will be represented in both rows.
Retention types
Recurring retention
Recurring Retention counts a user as part of a cohort if they performed the cohortizing event on that time period, irrespective of it was their first time or not.
First time retention
First time retention cohortizes users based on when they did an event for the first time, rather than adding a user to each cohort they had the event in.
Retention events
Cohortizing event vs. retaining event
The cohortizing event is the event that determines if the user is a part of a cohort or not (i.e. adds the user to the first column). The retaining event, on the other hand, is the event retention is being calculated on (i.e. adds the user as a data point to one of the "percentage boxes").
Retention vs. Stickiness
At the surface, both stickiness and retention insights can look very similar, and while they are closely related it's important to understand the differences between them.
- Retention - Measures the percent of users who came back and performed an event within a given period at least once
- Stickiness - Measures how many times within a period a user performed an event
Both stickiness and retention insights are important when analyzing how engaged users are with your product.
In general, retention is good at measuring how well you're doing at keeping users engaged overall, whereas stickiness measures how deeply users are engaging with your product.
Further reading
Want to know more about what's possible with Retention in PostHog? Try these tutorials:
Want more? Check our full list of PostHog tutorials.