What is a session?
A session is a set of events that have been grouped together to try to capture a single "use" of your product.
Session analysis helps you to understand product usage by uncovering how long users spend on your product, what they do during individual sessions, and how often they return.
This helps you to understand which of your features drive the most engagement.
How does PostHog define a session?
We group incoming events from our JavaScript Web library and all mobile SDKs into a single session until there's no activity for more than 30 minutes. Subsequent events are grouped into a new session.
Common questions
Can a session span different devices? No, sessions are tied to a single device and instance of a PostHog client. This means if a user is using two different browsers (e.g. Chrome and Firefox) they will be treated as two separate sessions.
Can a session span browser tabs and windows?: Yes, as a user moves between different tabs and windows, their events will be grouped into a single session. However, if they open a completely new browser (e.g. move from Chrome to Firefox) then a new session will be created.
Which clients support sessions?:
posthog-jsand all mobile SDKs (Android, iOS, React Native and Flutter) support session analytics.What defines user activity for a session?: User activity is defined as any event sent from the client (including Autocapture events). Also, if session replays are enabled, then user activity from the recording (like mouse movement) will extend the session.
Is there a limit on session length?: Yes, the longest allowed session is 24 hours. If a session is longer than that, it will be split.
Is a session the same as a recording?: Both sessions and recordings are tracked using the same ID. So, if a new session is created, then a new recording is created too.
Session analytics
You can analyze session counts and session duration by creating a trends insight in product analytics.
Session counts
You can aggregate trends by Unique sessions just as would Unique users or Weekly active users.
This provides the count of unique sessions where the specified event occurred. This can be helpful to remove the noise if you have specific events that are sent a bunch of times within a single session.
To do this analysis, simply select Unique sessions from the aggregation dropdown.


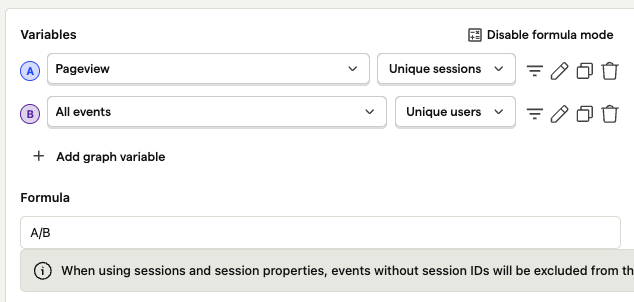
Using session counts in formulas
Combining session counts with other trends is a very powerful way to understand things like:
- The average number of sessions per user where a specific action occurs
- The average number of specific events per session
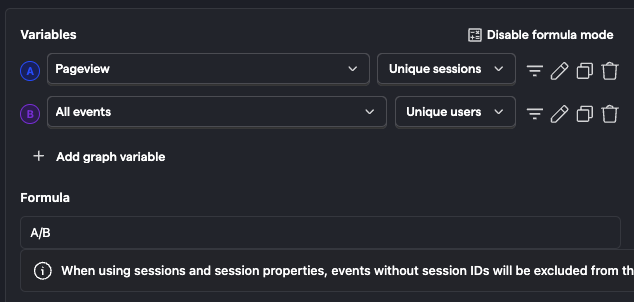
To do this analysis, simply make the series in your trends (e.g. unique sessions where an event occurs), and then use that series in a formula.


Filtering by session duration
Sometimes it can be helpful to filter out sessions that are either too short or too long. This enables you to dig into users who only use your product for a few seconds, or filter those users out, so you can better understand those who stick around longer.
You can use the 'Session duration' property in the property filters to accomplish this.


Plotting session duration
You can plot session durations over time to understand if your users are becoming more or less engaged with your product. To accomplish this, select one of the property aggregators (e.g median, 90th percentile etc.) and then select 'Session duration' as the property to plot.


Distribution of session duration
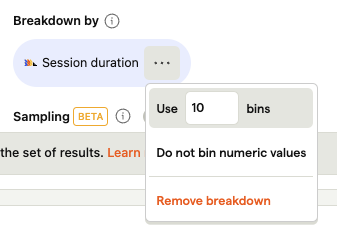
Breaking down data by the distribution of session durations can be useful when trying to understand why certain users behave a specific way. For example, you might find that users who complete a specific event are always in your product for over 10 minutes.
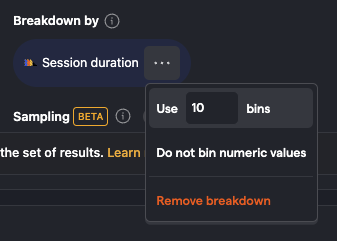
To look at the distribution of session durations, click 'Add breakdown' and then select the 'Session duration' property.

